Performance Map di Francesco De Stefano
Heatmap of resources loaded in the browser using the Resource Timing API
Devi utilizzare Firefox per poter installare questa estensione
Metadati estensione
Screenshot
Informazioni sull’estensione
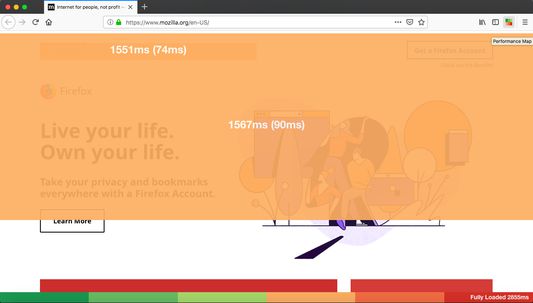
# PerformanceMap: front-end performance heatmap
Add-on to create a front-end performance heatmap of resources loaded in the browser using the Resource Timing API.
## Usage
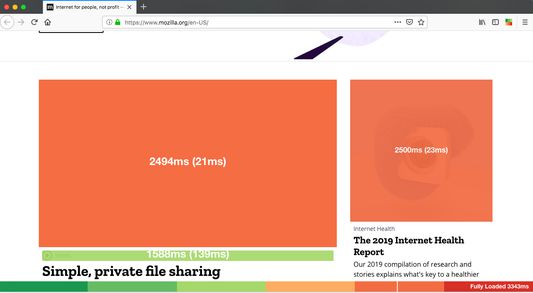
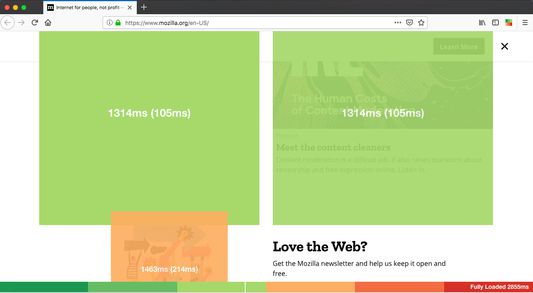
Wait for a page to fully load and then click WebExtension icon to overlay a performance heatmap.
The heatmap colours and the first ms value indicate at what point in the page load the image finished loading. It's a good indicator of user experience... "It took 3450ms before the user saw this image." The second value in brackets is the time it took the browser to load that specific image.
The legend attached to the bottom of the page shows timings for the full page load and hovering over a coloured area on the heatmap will move the timeline indicator to show you when that image was fully loaded.
## Credits
It is based on open source project - https://github.com/zeman/perfmap
Add-on to create a front-end performance heatmap of resources loaded in the browser using the Resource Timing API.
## Usage
Wait for a page to fully load and then click WebExtension icon to overlay a performance heatmap.
The heatmap colours and the first ms value indicate at what point in the page load the image finished loading. It's a good indicator of user experience... "It took 3450ms before the user saw this image." The second value in brackets is the time it took the browser to load that specific image.
The legend attached to the bottom of the page shows timings for the full page load and hovering over a coloured area on the heatmap will move the timeline indicator to show you when that image was fully loaded.
## Credits
It is based on open source project - https://github.com/zeman/perfmap
Valuta la tua esperienza utente
Sostieni lo sviluppatore
Sostieni il mantenimento e l’aggiornamento di questa estensione con una piccola donazione allo sviluppatore.
PermessiUlteriori informazioni
Questo componente aggiuntivo necessita di:
- Accedere alle schede
- Accedere ai dati di tutti i siti web
Ulteriori informazioni
- Link componente aggiuntivo
- Versione
- 1.2.0
- Dimensione
- 14,25 kB
- Ultimo aggiornamento
- 6 anni fa (15 mag 2019)
- Categorie correlate
- Licenza
- Mozilla Public License 2.0
- Cronologia versioni
Aggiungi alla raccolta
Altre estensioni di Francesco De Stefano
 Non ci sono ancora valutazioni
- Non ci sono ancora valutazioni
- Non ci sono ancora valutazioni
- Non ci sono ancora valutazioni
- Non ci sono ancora valutazioni
- Non ci sono ancora valutazioni